Use Auth0 App for Splunk
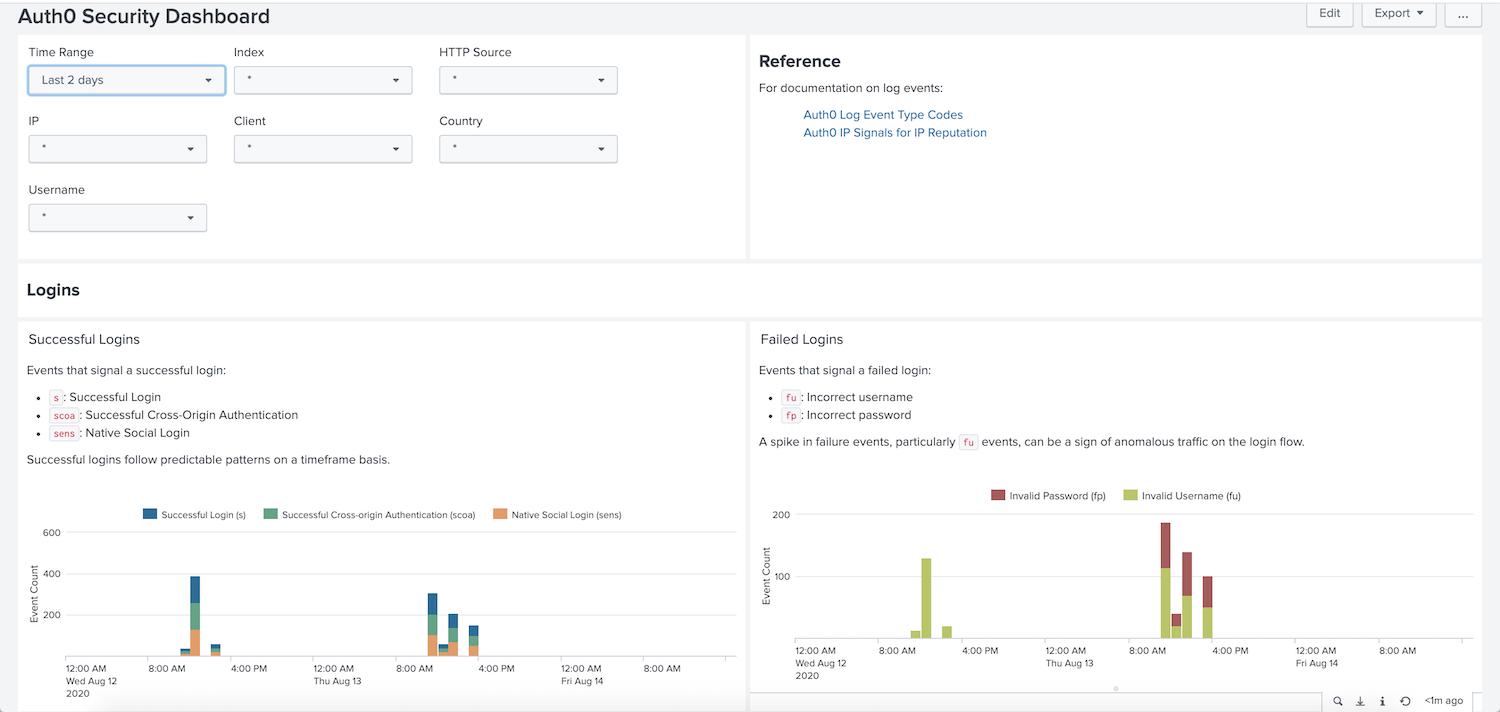
You can use the Auth0 App for Splunk to visualize the data from your Auth0 tenant in a Splunk dashboard. The dashboard allows you to monitor the health of the login traffic for a tenant. The app allows you to use recommended aggregations from Auth0, or to use them as a starting point to create your own custom visualizations.
Prerequisite
Configure log streaming to Splunk.
Install the Auth0 App for Splunk
Log into Splunk.
In the Apps sidebar, click Find More Apps.
In the Find apps by keyword, technology search bar, type Auth0.
Click the green Install button on the Auth0 App for Splunk card that appears.
Enter your username and password, accept the terms and conditions, and click Login and Install.
On the Complete widget that results, click on the Open the App button. The Auth0 Dashboard with default filters applied appears.

Dashboard filters
The following filters exist to allow you to drill down into the specifics of your traffic. You can enter * to search across all values for that field.
| Filter | Description |
|---|---|
| Time Range | A Splunk time input element that lets you choose the duration over which to view events. |
| Index | The Splunk index you want to search within. While creating your Http Event Collector Token, if you specified a particular index, you may use this value from the dropdown. |
| HTTP Source | The Splunk source name. |
| IP | The IP address whose traffic you want to inspect. This maps to data.ip in the log event. |
| Client | The client whose traffic you want to inspect. This maps to data.client_name in the log event. |
| Country | The country whose traffic you want to inspect. This is a field obtained using the iplocation data.ip search command in the query. It results in a Country field being added to each log event. |
| Username | The email address whose login traffic you want to inspect. This maps to data.user_name in the log event. |
Customize dashboard
You can customize your Splunk Auth0 security dashboard to add custom data widgets.
Navigate to your Auth0 security dashboard and select edit in the top right corner.
In the Edit Dashboard panel, select add panel and then choose a content type. For example line chart, event, or area chart.
Enter the time range, content title, and search string for the data visualization.
Select Add to dashboard to add your new data widget.
