Export Logs to Splunk
The Auth0 Logs to Splunk extension consists of a scheduled job that exports all of your Auth0 logs to Splunk, an analysis and visualization service for machine data.
To learn more, read Getting Started in Splunk.
Configure an HTTP Event Collector in Splunk
The HTTP Event Collector (HEC) is an endpoint that lets you send application events into Splunk Enterprise using the HTTP or Secure HTTP (HTTPS) protocols. To configure a new HTTP Event Collector for Auth0 logs and acquire the URL, Token, and Port information, do the following:
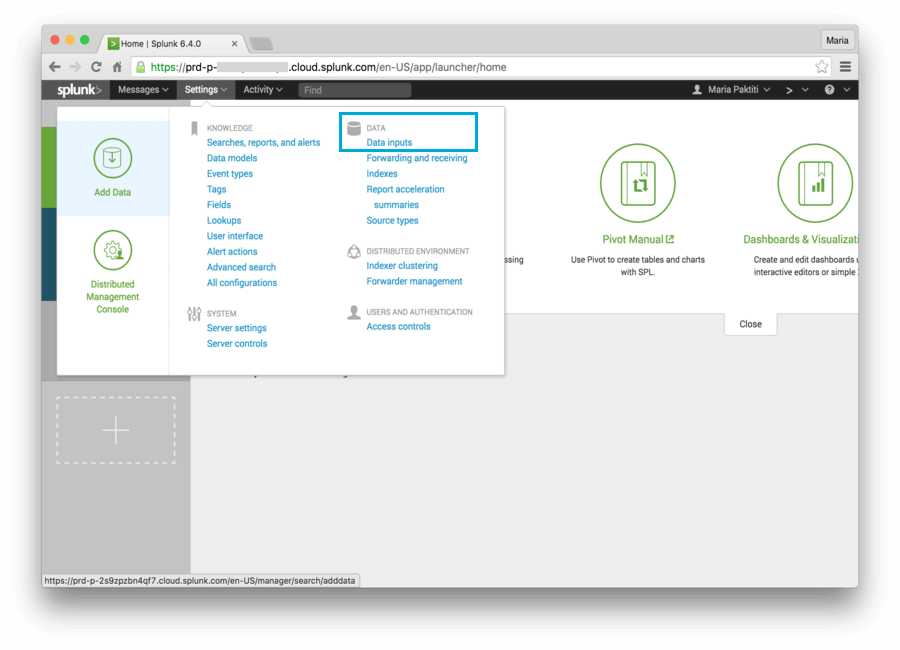
Navigate to your Splunk Cloud URL. You should have received this information via email upon signup. From the system menu, select Settings > Data Inputs.
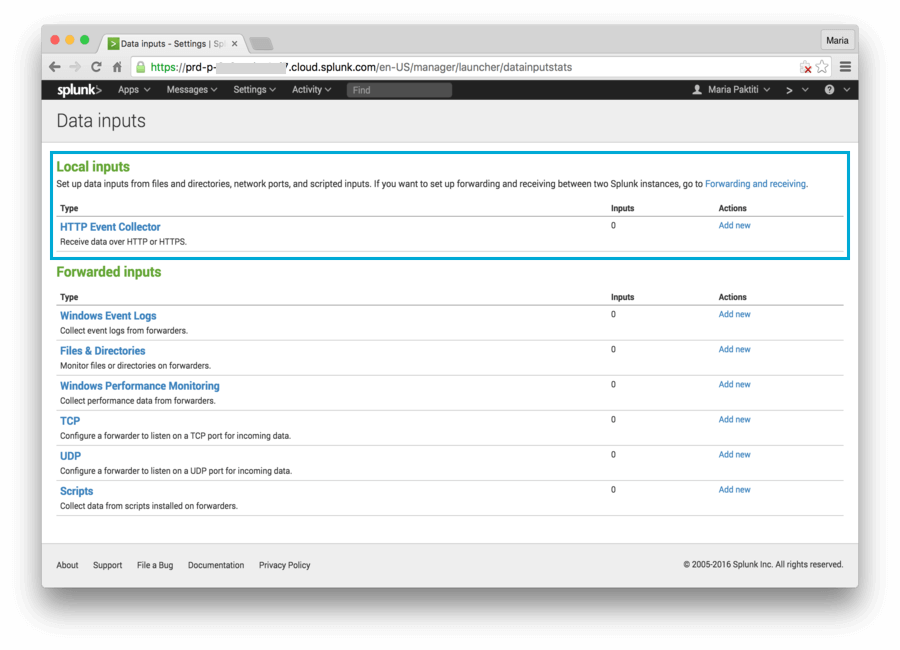
Select the Add New link under Local Inputs > HTTP Event Collector. A wizard, which will help you configure a new token for receiving data over HTTP, opens.
Set a name for the new token and click Next. We recommend naming it
auth0.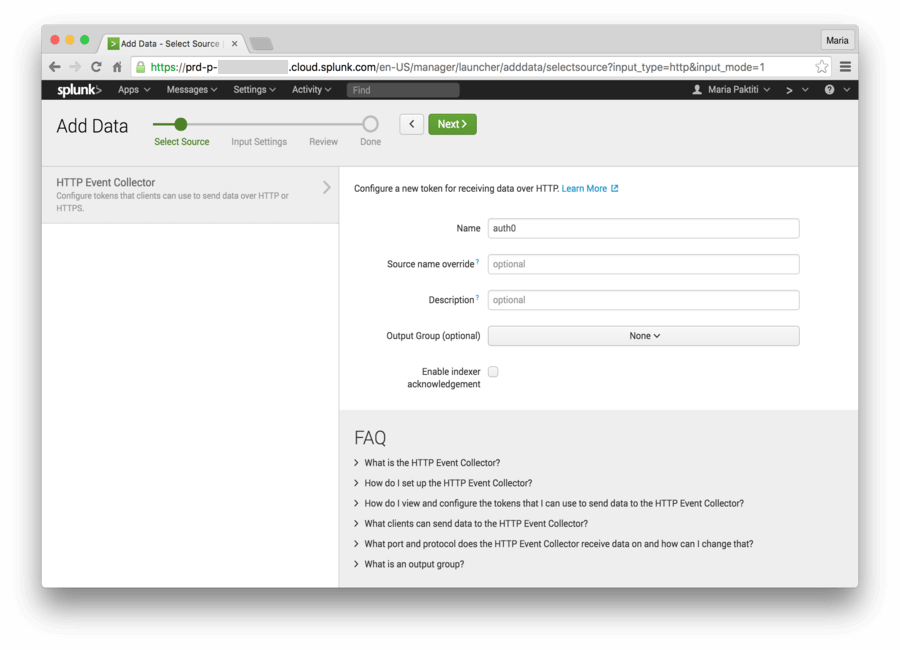
Select a Source type and an Index. Create a new Source type named
auth0, and usemainas your Index. Click Review.
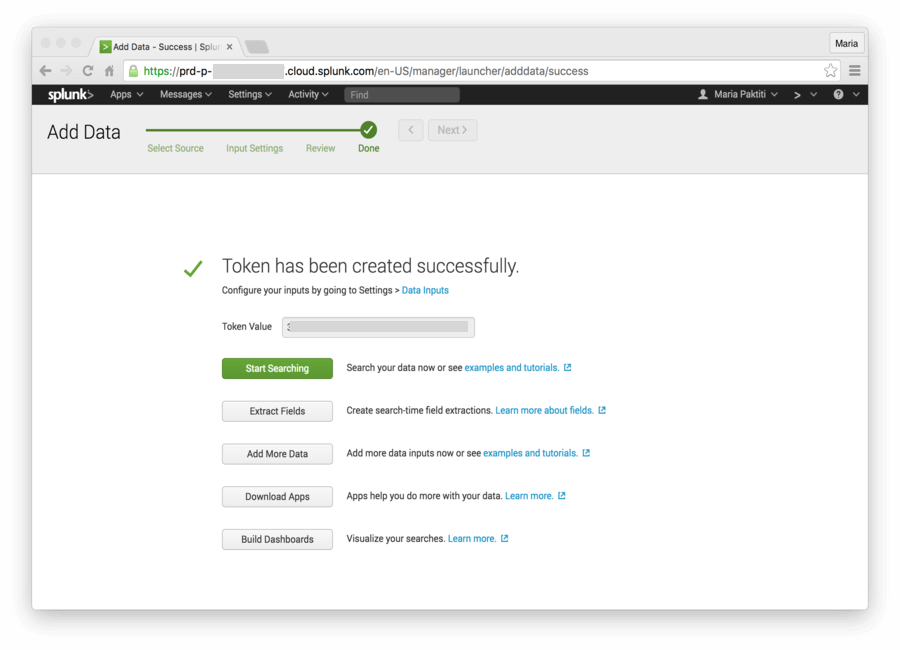
Review the information displayed, and click Submit. Your new token should be created successfully. Copy the value; this is your SPLUNK_TOKEN.


Test the HTTP Event Collector configuration
Make a quick test to ensure the HEC is properly configured and that your token is working.
Open a command prompt window or terminal.
Type the following cURL statement. Be sure to replace
<host>with your Splunk Enterprise or Splunk Cloud server's hostname, and<token>with the token you just copied to the Clipboard:curl -k https://<host>:8088/services/collector -H 'Authorization: Splunk <token>' -d '{"event":"Hello, World!"}'Was this helpful?
/As a response you should receive the following JSON:Splunk Cloud URL prefixes
The
<host>value is based on your Splunk Cloud URL. When creating requests to Splunk Cloud, you must add a prefix to the URI of the hostname according to your subscription. For self-service Splunk Cloud plans, prefix the hostname withinput-. For all other Splunk Cloud plans, prefix the hostname withhttp-inputs-. For this example, you have subscribed to a self-service Splunk Cloud plan, so use theinput-prefix. To learn more, see Splunk's Event Collector documentation.{ "text":"Success", "code":0 }Was this helpful?
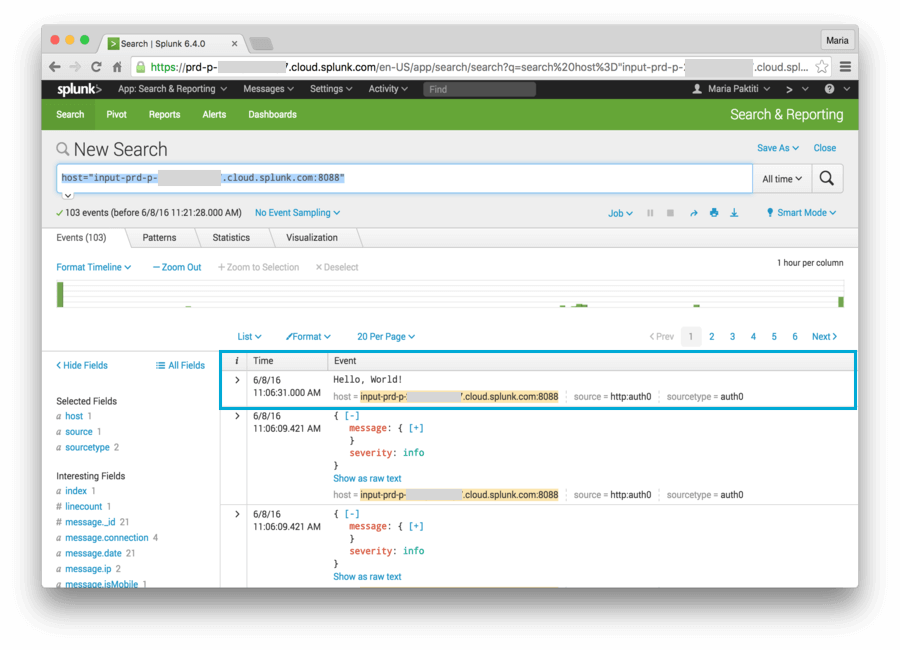
/Navigate to your Splunk Cloud URL. Click on Search & Reporting. Click on Data Summary, and select your host at the popup window.
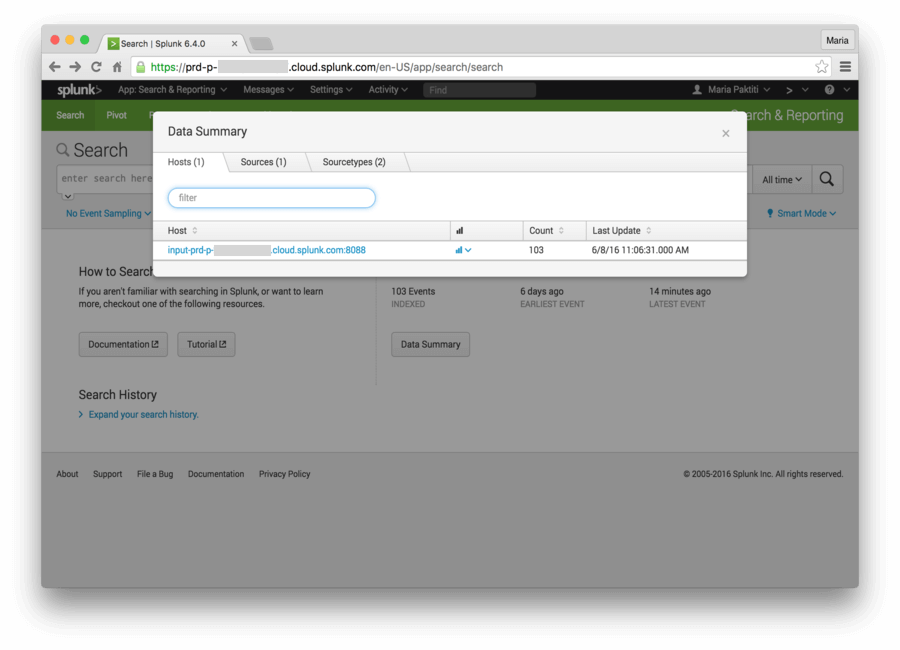

When the results of the search are displayed, you should be able to see at least one entry--for our Hello World example.
Configure the extension
To install and configure this extension:
Navigate to Auth0 Dashboard > Extensions, and select Auth0 Logs to Splunk. The Install Extension window opens.
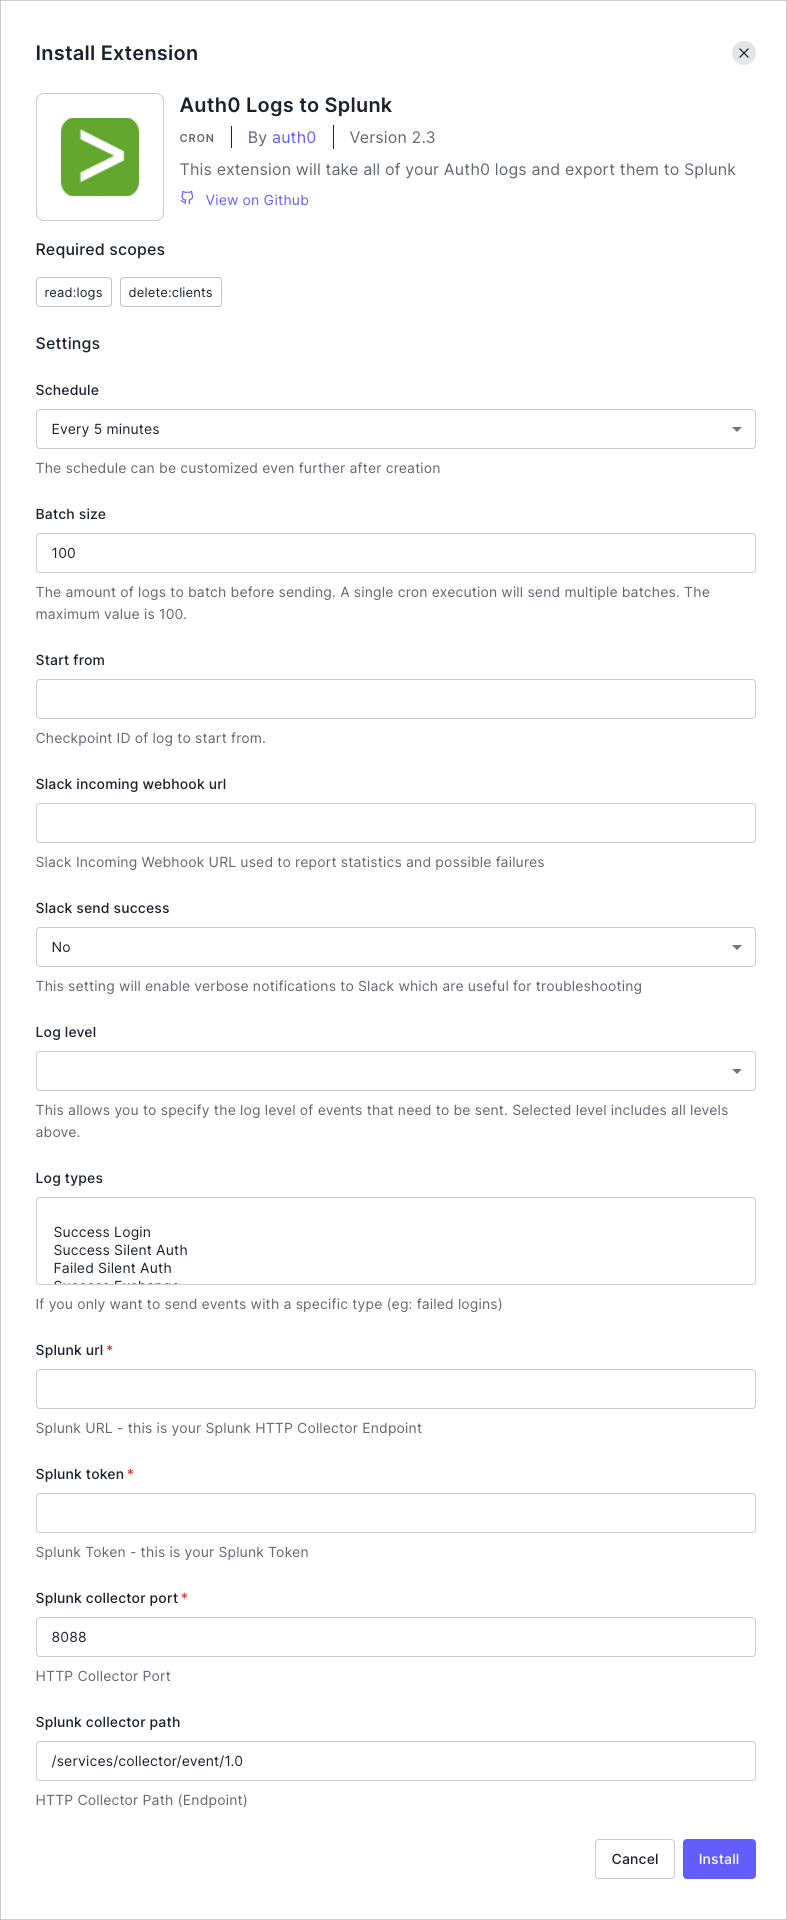
Set the following configuration parameters, and select Install:

Schedule: The frequency with which logs should be exported. The schedule can be customized even further after creation.
START_FROM: The checkpoint ID of the log from which you want to start sending. The value will be the log id (GUID).
SPLUNK_URL: Your Splunk Cloud URL.
SPLUNK_TOKEN: Your Splunk Token; use the value you copied in the previous section.
SPLUNK_COLLECTOR_PORT: The port of your HTTP Collector endpoint. The default is
8088.SPLUNK_COLLECTOR_PATH: Your Splunk HTTP Collector endpoint.
It should follow the following format:
https://<prefix>-<host>:8088/services/collector. The<host>is your Splunk Cloud URL. The<prefix>is eitherinput-orhttp-inputs-.Splunk Cloud URL prefixes
The
<host>value is based on your Splunk Cloud URL. When creating requests to Splunk Cloud, you must add a prefix to the URI of the hostname according to your subscription. For self-service Splunk Cloud plans, prefix the hostname withinput-. For all other Splunk Cloud plans, prefix the hostname withhttp-inputs-. For this example, you have subscribed to a self-service Splunk Cloud plan, so use theinput-prefix. To learn more, see Splunk's Event Collector documentation.
BATCH_SIZE: The number of logs to be sent per batch. Maximum is
100. Logs are batched before sending, and multiple batches are sent each time the extension runs.LOG_LEVEL: The minimal log level of events that you would like sent to Splunk.
LOG_TYPES: The events for which logs should be exported.
The integration between Auth0 and Splunk is now in place!
Batch size
When setting your BATCH_SIZE, please keep the following information in mind.
During each time frame/window (defined by your chosen Schedule), outstanding logs will be batched into groups and sent. The size of each group is determined by the BATCH_SIZE value.
In other words, during each window, NUM_BATCHES batches of logs will be sent based on the following logic:
IF (NUM_LOGS modulo 100 == 0):
  NUM_BATCHES = (NUM_LOGS / BATCH_SIZE)
ELSE:
  NUM_BATCHES = (NUM_LOGS / BATCH_SIZE) + 1
In the ELSE case, the last batch will have < 100 logs.
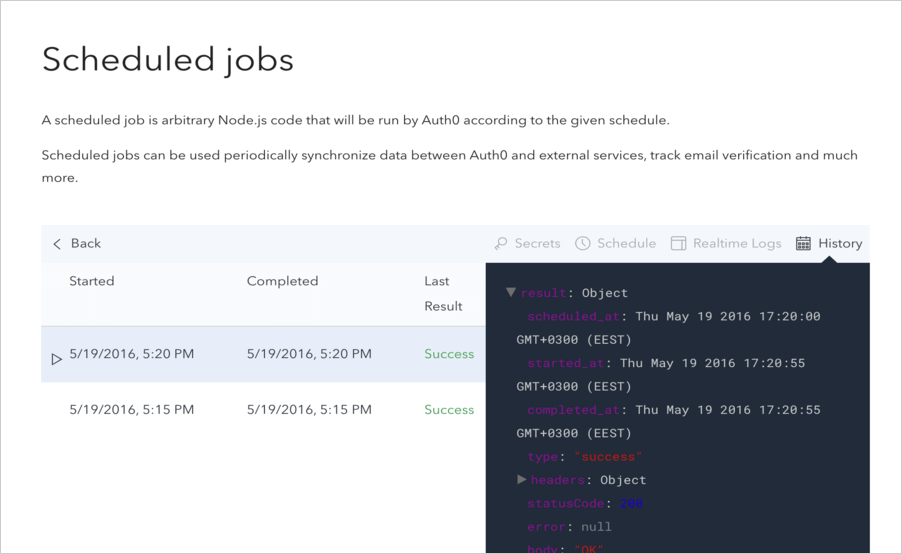
View results
The integration you just set up created a scheduled job that is responsible for exporting the logs according to the Schedule you selected for the extension.
To view this scheduled job:
Navigate to Auth0 Dashboard > Extensions, and select Installed Extensions.
Select Auth0 Logs to Splunk. The job you just created appears. You can modify its state by toggling the State switch, see when the next run is due, and see the result of the last execution.
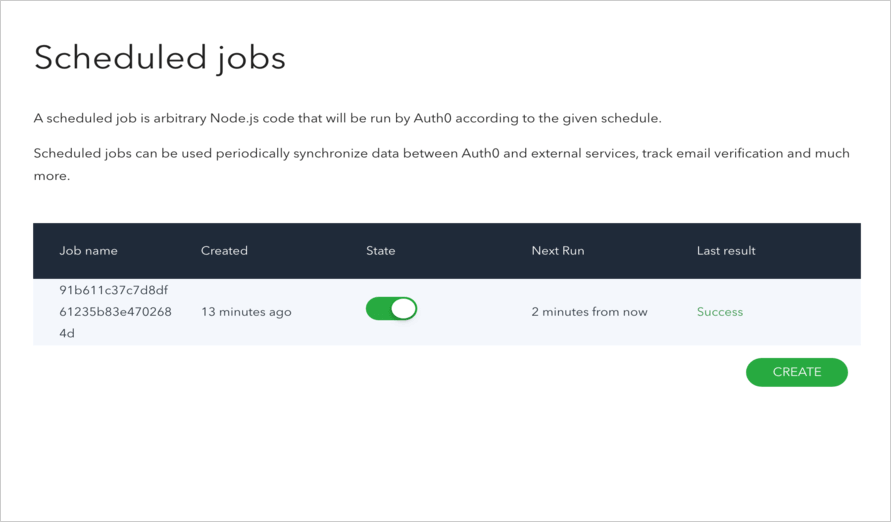

You can view more details by clicking on the job you created. On this page, you can view details for each execution, reschedule the job, access realtime logs, and more.
That's it; you are done! You can now navigate to your Splunk Cloud URL and view your Auth0 Logs. To search for the data associated with your host, click on Search & Reporting, then Data Summary, and select your host at the popup window.
Replay logs
In the event of a Splunk failure or service interruption, you can replay the logs starting from the failed log.
To replay logs:
Get the checkpoint ID of the failed log.
Navigate to Auth0 Dashboard > Extensions, and select Installed Extensions.
Select the gear icon to view Auth0 Logs to Splunk extension settings.
Enter the checkpoint ID in the START_FROM field.
Select Save.
Integrate with Slack
This extension can send failed transaction notifications to Slack with the checkpoint code displayed in the message. To set up the integration:
Get the Slack Incoming Webhook URL.
Navigate to Auth0 Dashboard > Extensions, and click Installed Extensions.
Select the gear icon to view Auth0 Logs to Splunk extension settings.
Enter the Slack Incoming Webhook URL in the SLACK_INCOMING_WEBHOOK field.
Select Save.
You can also enable verbose notifications by enabling the SLACK_SEND_SUCCESS setting.